Project status reporting that stays connected to the project.
A status report should be a view of the project record on a given date, not a document assembled beside it once a month. Flowr builds the monthly report from the project’s own milestones, risks, progress, effort and cost — and then hands it to the project manager to edit and sign.
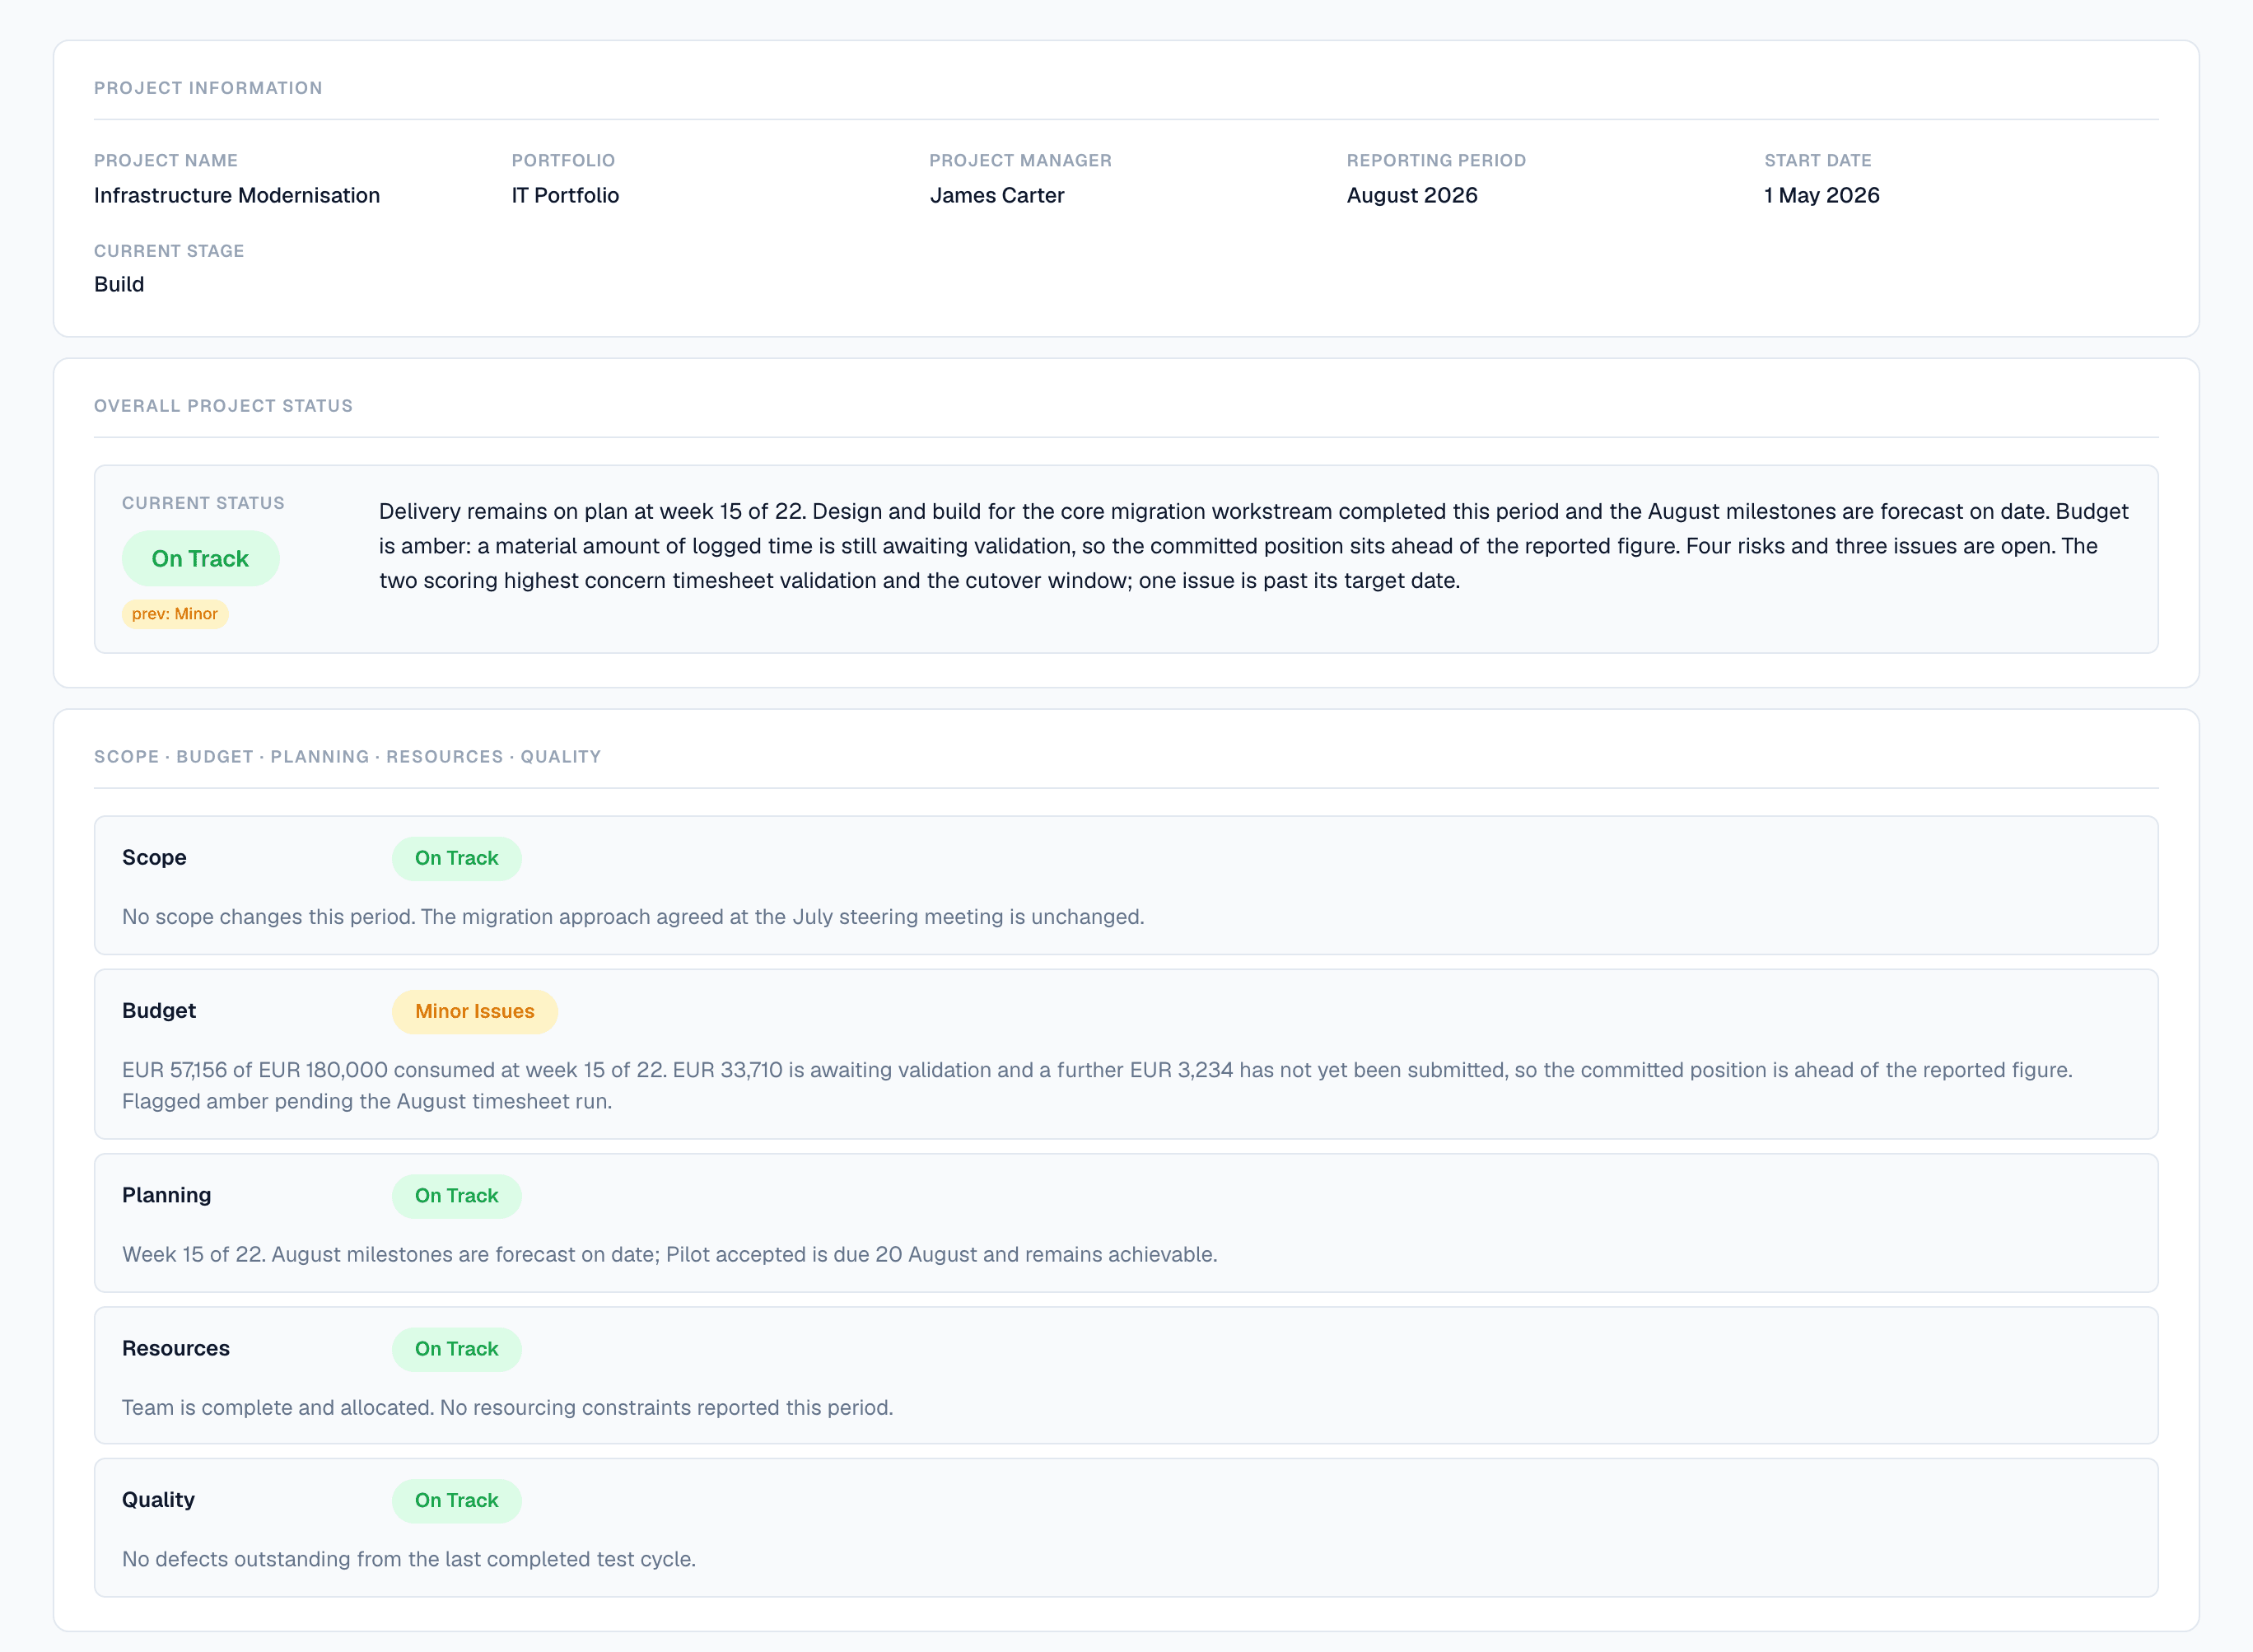
By the time the report is finished, it describes a project that has moved.
The usual process is not badly run. It is simply long, and every step of it puts more distance between the document and the thing it describes.
- Updates are requested from project managers, on a template, with a deadline.
- The answers are copied into slides or a spreadsheet, losing whatever they were linked to.
- The financial position is reconstructed by hand, from a different system and a different cut-off date.
- RAG is assigned from judgement that is never written down beside the rating.
- The pack is distributed, read once, and starts ageing immediately.
Next month it happens again, from the beginning, and nothing produced last month makes this month shorter.
Assembled from live data. Edited and signed by a person.
Flowr composes the status report from the project record as it stands: milestone dates and status, open risks and issues, task progress, effort logged against the plan, cost incurred against the approved budget, and the current forecast. The project manager then writes the narrative, sets the ratings and submits it.
Once submitted it is readable by the organisation, and exportable as a print-ready A4 PDF with the RAG colours preserved — a document, rather than a screenshot of a screen.
Ratings that stay separate
Scope, Budget, Planning, Resources and Quality are rated individually alongside the overall status, so a single amber does not vanish inside a green summary.
The previous period, in view
Each report shows what the last one said, so a project moving from Minor to On Track is visible as a movement rather than as a fresh assertion.
Every rating has something under it.
The report is not the only place these numbers exist, which is the point. Each figure in it is the project’s own — so a reader who doubts a rating can go to the measurement rather than to the person who typed it.
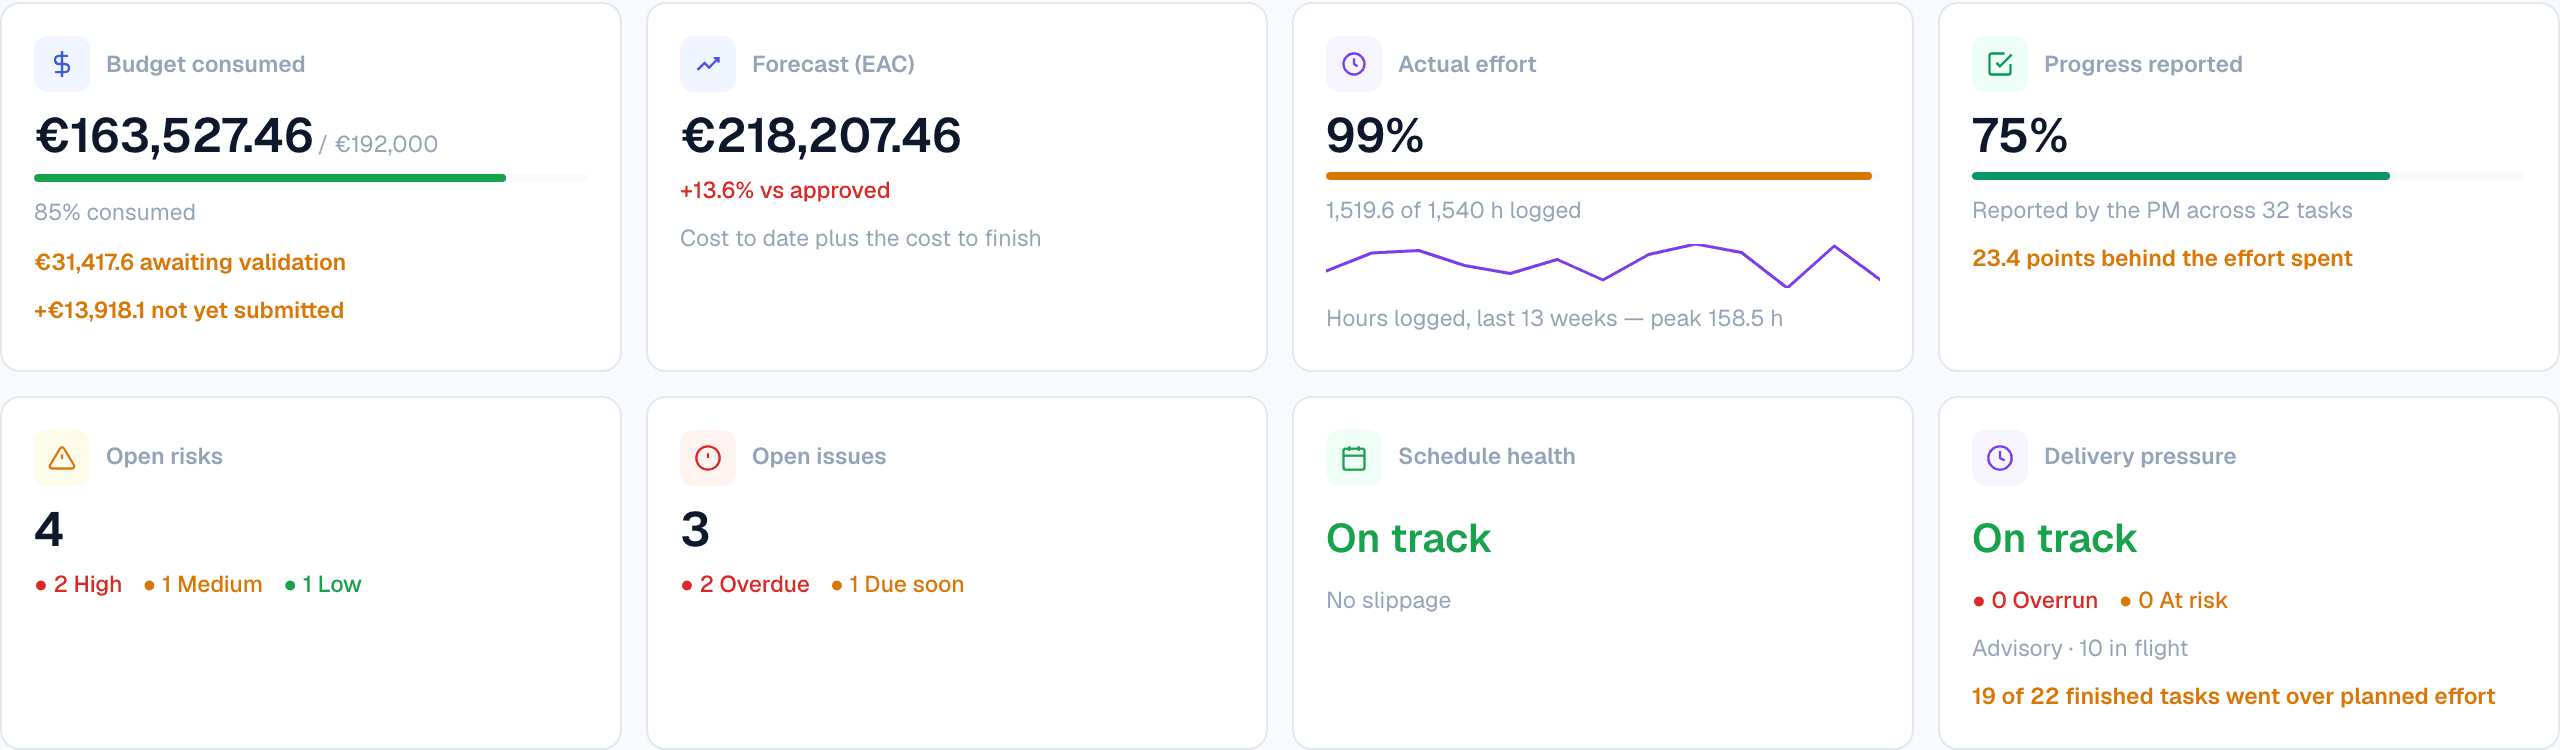
Submitted time becomes actual cost at the rate in force on the date it was worked. Approving it marks it validated and never changes the total.
EAC is reported against both the approved budget and the baseline, because over the plan and over the budget escalate differently.
Counts in the report come from the live registers, with owners and escalation, not from a list retyped for the meeting.
Last month keeps saying what it said.
Reporting periods open and close. A closed period is frozen, so the figures a report was signed against do not quietly change afterwards. A period can be reopened when it genuinely has to be — and the reopening is recorded, which is the difference between a correction and a rewrite.

Where someone overrides the modelled forecast, that is stored as a decision with a reason and an author rather than applied as a silent edit. A year later the question “why did we think that in August” still has an answer.
Flowr evaluates. It does not decide.
Tolerances set once for the organisation tell Flowr which side of a threshold a project has landed on — 5% budget variance for warning, 10% for critical, and the same for schedule slippage and overdue milestones. That evaluation is applied consistently to every project, which is what makes portfolio RAG comparable.
What it does not do is set the status. The delivery signal — effort consumed against progress reported — is advisory: it raises the question and shows the tasks behind it, and the project manager answers it in the narrative. A project can be amber on the numbers and On Track in reality, and the report is where that is argued rather than hidden.
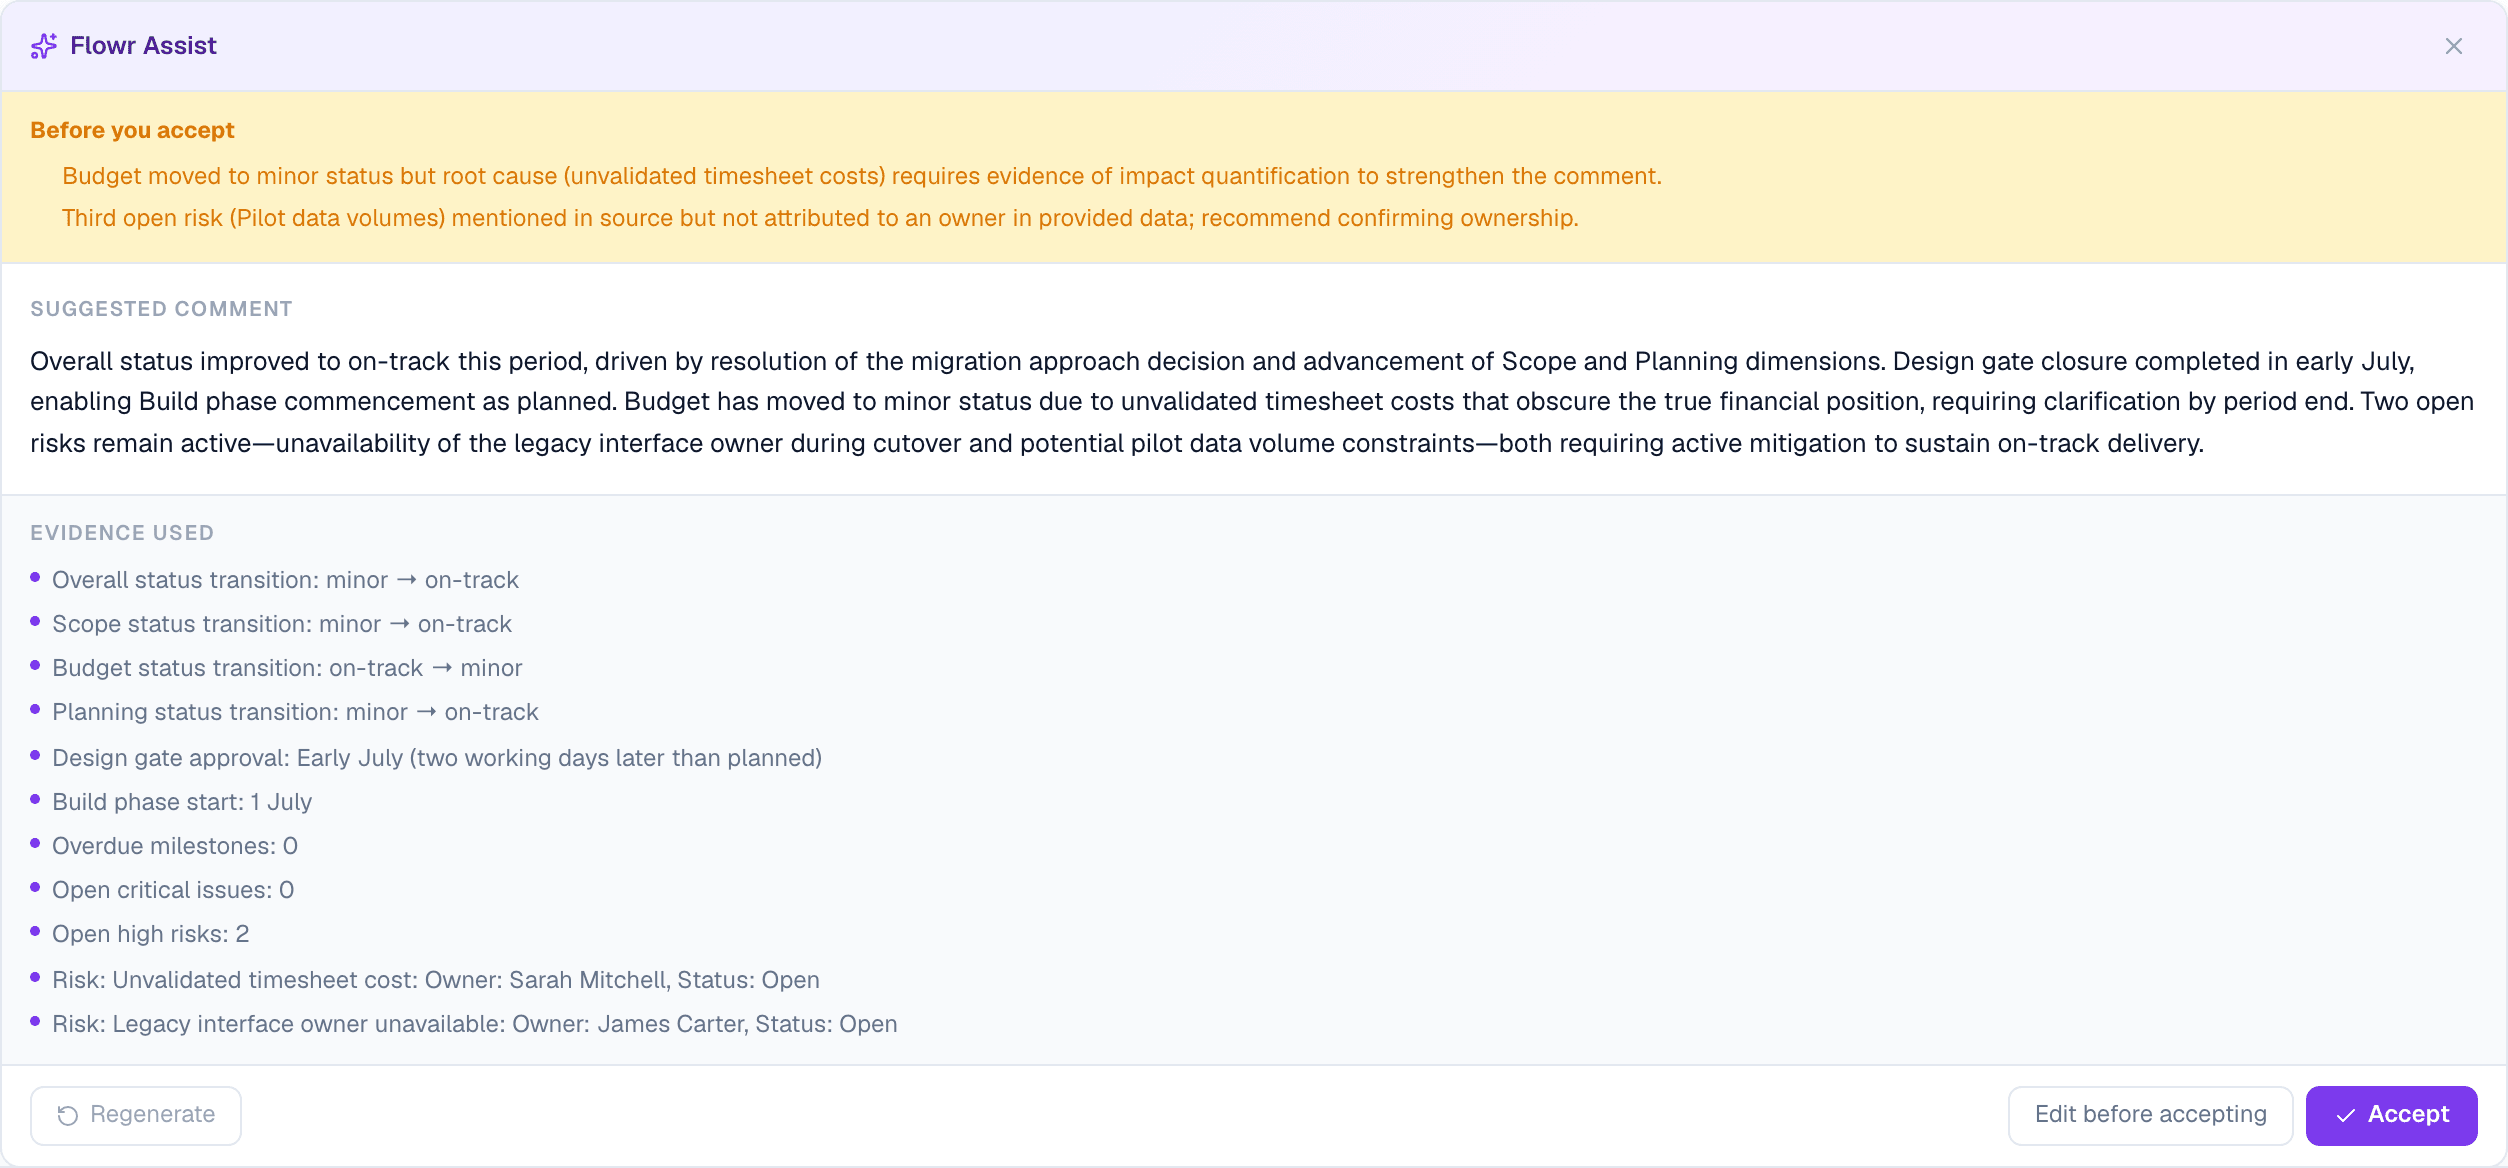
Flowr Assist is off until an administrator turns it on for the whole organisation. While it is off the server refuses every AI request and no project data is sent.
The report is the roll-up’s source, not its summary.
Because every project reports into the same model, the portfolio view is built from the reports themselves. There is no second consolidation step, and therefore no month in which the portfolio and the projects say different things.

Produce next month’s report from the project itself.
The test worth running is a single reporting cycle on a real project: the same month, reported the usual way and reported from the record, and see which one you would rather defend. Early access is granted one workspace at a time so we can set that up with you.